Thistle Service Data
Data up to end of June 2026
See below for definitions of Data.
| Service User Data | Number |
|---|---|
| Total Unique Service Users attending the service | 752 |
| Total Unique Male Service Users attending the service | 588 |
| Total Unique Female Service Users attending the service | 164 |
| Month/Year | Service Accessed | Injecting Episodes | Medical Emergencies |
|---|---|---|---|
| Jan 25 | 336 | 268 | 0 |
| Feb 25 | 684 | 523 | 5 |
| Mar 25 | 864 | 609 | 12 |
| Apr 25 | 847 | 610 | 13 |
| May 25 | 737 | 451 | 5 |
| June 25 | 893 | 547 | 4 |
| July 25 | 938 | 546 | 9 |
| August 25 | 848 | 514 | 8 |
| September 25 | 1018 | 699 | 4 |
| October 25 | 1071 | 785 | 9 |
| November 25 | 1097 | 814 | 9 |
| December 25 | 1486 | 1094 | 10 |
| January 26 | 1288 | 896 | 9 |
| February 26 | 1582 | 1136 | 21 |
| March 26 | 1469 | 1006 | 19 |
| April 26 | 1515 | 994 | 15 |
| May 26 | 1533 | 1063 | 19 |
| June 26 | 1466 | 1060 | 15 |
| Total | 19,672 | 13,615 | 186 |
Substances used as percentage of Total
| Month/Year | Cocaine | Heroin | Heroin and cocaine (snowball) |
|---|---|---|---|
| Jan 25 | 84.1% | 13.4% | 2.6% |
| Feb 25 | 60.0% | 21.4% | 18.6% |
| Mar 25 | 57.0% | 20.9% | 22.0% |
| Apr 25 | 68.2% | 23.7% | 8.1% |
| May 25 | 62.6% | 28.6% | 8.5% |
| June 25 | 71.9% | 20.0% | 8.1% |
| July 25 | 73.8% | 19.6% | 5.8% |
| August 25 | 65.4% | 28.5% | 6.1% |
| September 25 | 73.4% | 14.2% | 11.9% |
| October 25 | 81.5% | 9.7% | 8.8% |
| November 25 | 77.3% | 10.4% | 12.4% |
| December 25 | 81.8% | 10.6% | 7.4% |
| January 26 | 80.8% | 10.2% | 9.0% |
| February 26 | 70.0% | 23.0% | 6.8% |
| March 26 | 67.1% | 26.8% | 6.0% |
| April 26 | 63.9% | 29.4% | 6.7% |
| May 26 | 58.5% | 32.3% | 9.1% |
| June 26 | 51.4% | 34.3% | 14.2% |
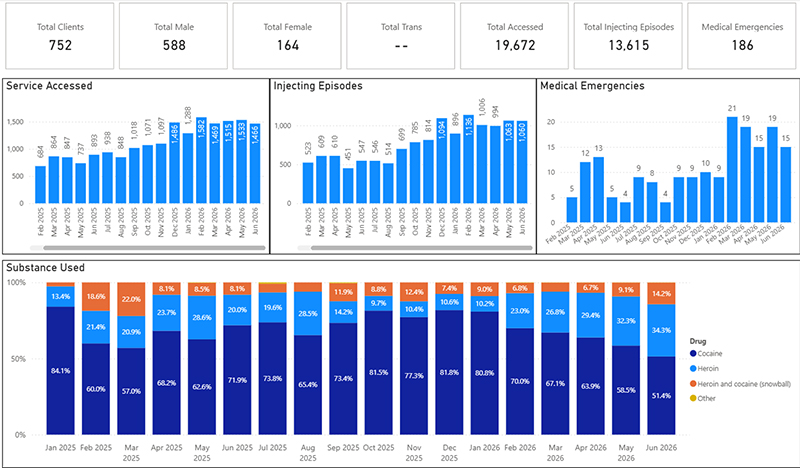
Data as bar charts
Data Definitions
- Service Users
This indicates the number of distinct / unique individuals who are registered to and have accessed the service on at least one occasion. Access is not limited to the use of the injecting area and includes wound care, use of the shower, clothing store or laundry facilities.
- Service Users Male
Those registered to and using the service on at least one occasion who identify as male.
- Service Users Female
Those registered to and using the service on at least one occasion who identify as female.
- Times Service Accessed
This indicates the number of distinct / unique occasions when the service has been accessed by a service user registered with the service.
Note: This does not include any visits to the service by any person not registered to receive services available at the facility.
- Injecting Episodes
This indicates the number of distinct / unique occasions when the injecting booths have been accessed to enable the service user to prepare and inject the substances they have purchased elsewhere and brought into the facility.
- Medical Emergencies
This indicates the number of distinct / unique episodes where a service user has required some level of intervention from the staff following the self-administration of the substances they have purchased elsewhere and brought into the facility.
This includes interventions from enhanced observation of the service user to administration of oxygen, naloxone or resuscitation.
Bar Charts
- Service Accessed
Displays the number of distinct / unique occasions when the service has been accessed by a service user registered with the service on the month indicated.
- Injecting Episodes
Displays the number of distinct / unique occasions when the injecting booths have been accessed by a registered service user to prepare and inject the substances they have purchased elsewhere and brought into the facility.
- Substances Used
Indicates the substances declared by the registered service user, as the substance they have purchased elsewhere and brought into the facility and intend to use during that injecting episode. The data is expressed as a percentage of the total to enable comparison on a month-by-month basis of the proportion of each drug being consumed within the facility.
Note: this is the substance declared by the service user as the substance they believe they have purchased / intend to use, and may not reflect the actual substance used, either intentionally or unintentionally.
- Medical Emergencies
This indicates the number of distinct / unique medical emergency episodes, as defined above, not service users experiencing a medical emergency, occurring within the facility on a month-by-month basis.
Service Evaluation
The Thistle service has been set up in light of existing experience of safer drug consumption facilities elsewhere in the world and evidence of their effectiveness. However, as it is the first sanctioned safer drug consumption facility to open in the UK, an extensive independent evaluation (called ENACT) of the service will be undertaken.
The ENACT study is being carried out by a research consortium led by Glasgow Caledonian University and the University of Glasgow, and is funded by the National Institute for Health and Care Research (NIHR). ENACT will run until April 2029, and will examine the following:
- Implementation and reach of the service, users’ experiences of service engagement, barriers and facilitators to delivery, and the role of context in shaping delivery and outcomes,
- The impact of the Thistle service on health and social outcomes of people who inject drugs,
- The impact of the Thistle service on the wider community in which the service is located, and
- The cost-effectiveness and cost-utility of the service and its potential long-term impacts on a range of health harms.
Further information about ENACT can be found on these two websites: